Upgrade Notice
The CPAN Testers Statistics site has been upgraded since you last accessed the site. Please press the F5 key or CTRL-R to refresh your browser cache to use the latest javascript and CSS files.
Performance
Contents
Graphs
The graph below highlights the rate at which testers are producing reports and the number of requests that the CPAN Testers Reports Website Builder can process in a day. Slow periods for the Builder are when the server has experienced high load, typically when website crawler bots fail to honour our robots.txt file.
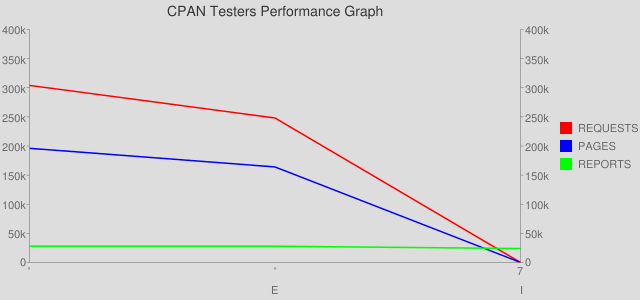
The REQUESTS measure the total number of requests processed by the system, while PAGES is the number of unique requests processed. A request is created when a report is submitted, a new distribution is uploaded or a website user requests a page on the dynamic Reports website, where a previous request exists. A page can either be a distribution page or an author page. Also note that for every unique page requested, 6 files are generated across 3 websites by the CPAN Testers Reports Website Builder.
Raw Data
The raw data file is available here:
Graphs generated using the Google Chart API.